The City of Quincy has engaged with FEMA to update the city’s flood map, a revision that may affect many properties by either adding them to or removing them from flood zones. These changes reflect evolving flood patterns and the city’s mitigation efforts. The updated 2025 flood maps, along with the 2017 versions, are now available on the city’s website at quincyma.gov. By checking your property, you can determine if your home has been newly added to the flood map—potentially requiring flood insurance if you have a mortgage—or removed, which may allow you to cancel your flood insurance. Through the great work of our city employees, most of the impacted homes are being removed from the flood map, with very few being added. The 2025 FEMA flood map updates are available now online and will take effect on July 8th, 2025, so now is the time to review how these changes might impact you.
How to Check Your Home on the FEMA Flood Maps
Follow these steps to use the City of Quincy’s GIS viewer to see how the 2025 flood map updates affect your property compared to the 2017 map. Screenshots are included below to guide you through the process.
Visit the City’s Website and Access the GIS Viewer
Go to quincyma.gov.
At the top of the page, hover over the “Business” tab in the navigation bar to reveal the drop-down menu.
Click on “GIS Property Viewer” to launch the tool in a new window.

Screenshot 1 - The City of Quincy homepage with the "Business" tab and "GIS Viewer" link highlighted.
Search for Your Property
In the GIS viewer, locate the search bar at the top right of the screen.
Enter your home address (e.g., “44 Marion St”) and click the magnifying glass or press Enter.
The search results will appear on the right side, listing your property with details like the parcel number (e.g., 5179-14-13) and owner name. The map on the left will zoom to your property, highlighting it with a green outline.

Screenshot 2: GIS viewer showing a search for "44 Marion St" with the property (5179-14-13) highlighted on the map and listed in the search results.
Add the Flood Map Layers
At the top of the GIS viewer, click on the “Themes” button (it looks like stacked sheets) to open the Themes panel on the right.
In the Themes panel, click on the “Flooding” theme to expand it.
You’ll see two options: “2025 Preliminary FEMA National Flood Hazard Layer” and “2017 Corrected FEMA Flood Maps.” Check the boxes next to both to display them on the map.
The flood zones will appear overlaid on the map, color-coded as follows: blue for “1% Annual Chance Flood Hazard” (100-year flood zone), orange for “0.2% Annual Chance Flood Hazard” (500-year flood zone), and other patterns for regulatory floodways or areas with reduced risk due to levees.

Screenshot 3: GIS viewer with the Themes panel open, showing the "Flooding" theme with the 2025 FEMA flood map layer toggled off.
Compare the 2017 and 2025 Flood Maps
Ensure your property is in view on the map. If needed, use the search bar again to zoom in on your address (e.g., “44 Marion St”), or use the zoom tools on the left side of the map to focus on your property.
With both layers turned on, you may need to toggle one off to compare them individually. Uncheck the “2025 Preliminary FEMA National Flood Hazard Layer” to view only the 2017 map, then recheck it and uncheck the “2017 Corrected FEMA Flood Maps” to view the 2025 map.
Alternatively, use the “Transparency” slider next to each layer in the Themes panel to adjust the opacity and see both layers more clearly. See Screenshot 7.
Look for the color-coded zones around your property: if it’s in a blue area (1% annual chance flood hazard), it’s in a 100-year flood zone; if it’s in an orange area (0.2% annual chance flood hazard), it’s in a 500-year flood zone; if it’s in a non-shaded area, it’s not in a flood zone.
The screenshots below show a broader view of Quincy to illustrate the flood zones. The 2017 map (Screenshot 4) shows more extensive blue areas (100-year flood zones) along Furnace Brook Parkway, while the 2025 map (Screenshot 5) shows some of these areas reduced and replaced with orange (500-year flood zones), indicating a lower risk in some areas due to updated flood patterns or mitigation efforts.

Screenshot 4 - GIS viewer showing the 2017 Corrected FEMA Flood Maps with 100-year flood zones in blue along Furnace Brook Parkway.
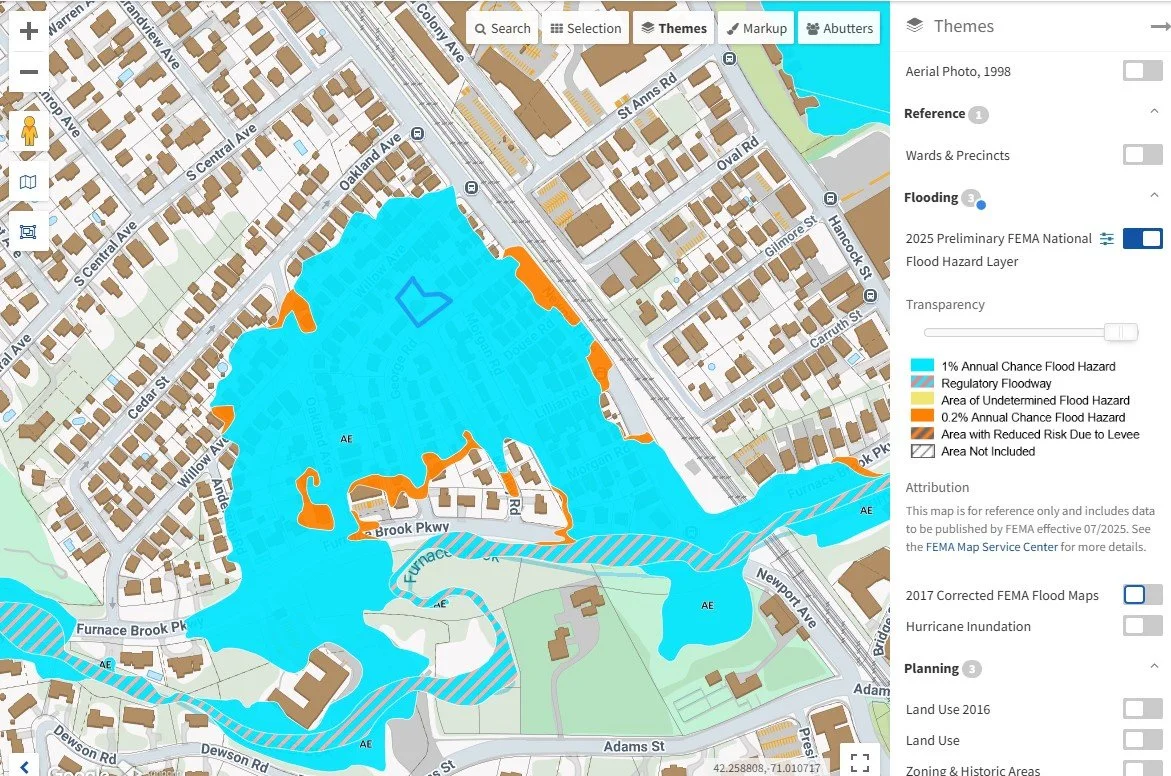
Screenshot 5: GIS viewer showing the 2025 Preliminary FEMA National Flood Hazard Layer with reduced 100-year flood zones (blue) and expanded 500-year flood zones (orange) in the same area

Screenshot 7 - GIS viewer showing the 2025 Preliminary FEMA National Flood Hazard Layer and the 2017 Corrected FEMA Flood Maps with 100-year flood zones in different shades of blue.
Interpret the Results
Added to the Flood Map: If your home is in a flood zone (blue or orange) on the 2025 map but not the 2017 map, you may need flood insurance starting in 2026 if you have a mortgage.
Removed from the Flood Map: If your home is outside the flood zones on the 2025 map but was in a flood zone on the 2017 map, you may no longer need flood insurance—check with your lender or insurer.
No Change: If your status remains the same, no immediate action is required.
Need Help?
If you’re unsure about the results or how to proceed, contact the City of Quincy or FEMA’s helpline at 1-800-621-FEMA.
Take Action
The 2025 FEMA flood map updates will take effect on July 8th, 2025, so now is the perfect time to check your property and understand your flood insurance requirements. Whether your home has been added to or removed from the flood map, knowing your status can help you plan ahead—whether that means purchasing flood insurance or exploring your options to cancel it. If you have questions or need assistance, don’t hesitate to reach out to the city or FEMA for support. Stay informed and prepared, Quincy neighbors!
